ZStack Cloud Platform
Single Server, Free Trial for One Year

Comprehensive product documentation and tools

Upholding the value of Customer First and the mission of Serving Customer, ZStack is dedicated to providing secure and stable services for customers.

To educate ZStack partners and interested individuals about cloud computing and to cultivate cloud computing talent.

ZStack provides innovative cloud infrastructure for ten major industries
The report provides three major
solutions and customer case studies for transitioning from VMware to ZStack.
With the rapid development of information technology, enterprises are increasingly in need of efficient and stable application systems. However, as the complexity of cloud environments continues to increase, the problems faced by operations and maintenance personnel are becoming more diverse and difficult. Maintaining and managing complex infrastructure is a very challenging task. With the growth of business and the increase in system complexity, the deep integration of applications and systems has brought new challenges. It is crucial to discover and solve problems in a timely manner. How to quickly and accurately troubleshoot and locate faults has become an important challenge in operation and maintenance management. Traditional manual troubleshooting methods are often time-consuming and labor-intensive. In this context, the Octopus tool came into being, injecting new vitality into the automated operation and maintenance of the system.
Octopus is an automated troubleshooting tool designed specifically for user system environments. It integrates multiple diagnostic, monitoring, and analysis functions to quickly and accurately locate system problems. Octopus’ goal is to simplify the operation and maintenance process, improve troubleshooting efficiency, and allow operation and maintenance personnel to focus more on system optimization and business innovation.
In the cloud environment, modern business systems are often diverse and complex, including performance bottlenecks, dependency conflicts, resource contention, and integration with the underlying system. The underlying cloud system itself is also a very complex software ecosystem, involving all aspects of network, computing, and storage, and involves a lot of very low-level knowledge, such as hardware drivers, OS kernels, underlying storage, underlying network protocols, and virtualization knowledge such as qemu, kvm, and sdn. When a business fails, timely troubleshooting and system recovery require extremely high knowledge and tool reserves of operation and maintenance personnel. Octopus provides an extensible framework to solve this problem.
Troubleshooting these application chain problems, application and cloud environment integration problems, cloud environment bottom-level problems, etc. often requires a variety of targeted tools. For example, to troubleshoot network problems, you need tcpdump packet capture tools, iptables tools, ping, mtr and other network detection tools. In modern Linux kernel versions that support ebpf, ebpf-based bcc, bpftrace, and self-developed tools are very helpful for troubleshooting. However, as ZStack Cloud has 4S advantages, simplicity is a very important feature. If all tools are integrated into the Cloud iso, the firmware will be huge, causing a lot of inconvenience to users. Therefore, Octopus provides the feature of on-demand installation and use. Only when troubleshooting problems will tools be dynamically provided on demand.
During the long-term operation of the product, various scripts will be accumulated, such as testing a specific parameter of the network, testing the accessibility of the application port, and testing a specific functional data of distributed storage. These scripts are often scattered. When troubleshooting problems, they need to be found and uploaded to the customer environment. They may also need to go through approval processes, which will reduce the troubleshooting efficiency. Octopus unifies these scripts, classifies them, and provides them in the form of a cli command line interface, which can be used immediately when needed.
In the daily operation and maintenance process, for a certain troubleshooting task, more than 80% of the steps are fixed, such as the first step to check the service status, the second step to search for a specific content in a log, the third step to check the resource usage of a process, the fourth step to search for a specific table item in iptables/ebtables, and the fifth step to capture packets with certain characteristics in all network paths from vm a to vm b, etc. Octopups integrates these fixed processes and steps and provides them to operation and maintenance personnel in the form of commands. Operation and maintenance personnel only need to enter a name to complete these steps. Currently, dozens of commands are supported, and some of them will be introduced below.
Octopus provides completion for almost all commands and parameters, and supports fuzzy completion and history completion, so that for any command, the number of keystrokes required by operators will not exceed about 10 times, and for common commands, it is reduced to about five times, greatly reducing the burden on operators and improving operation and maintenance efficiency.
As the foundation of enterprise IT systems, the security of IaaS systems is very important. In addition to the security rules added by ZStack Cloud, enterprises may deploy professional security software and many firewall rules. Sometimes, due to certain needs, users will also deploy additional software that will issue firewall rules on Cloud nodes, or in some cases, firewall rules may be inconsistent with the plan. The experience of 3,000+ customers tells us that sometimes the number of firewall rules on a node may be hundreds or thousands. Once the network is abnormal, such as rule conflicts or inconsistencies, it is very difficult for operation and maintenance personnel to manually troubleshoot specific problems one by one. It takes a long time, and for customers, it also increases the time their business is affected. Octopus provides the command trace_iptables to automatically diagnose whether it is an iptables rule problem and the specific rules that cause the problem.
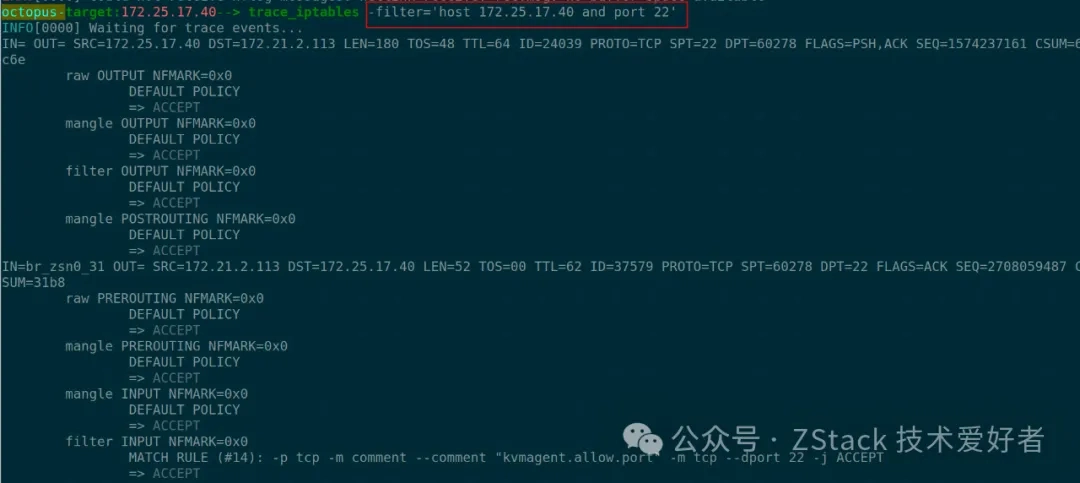
This command can use -filter to specify the IP and port information that needs to be checked. The syntax supports tcpdump’s bpf filtering syntax. It is very easy to use. As shown in the figure above, it means that it is not an iptables problem and all actions are ACCEPT.
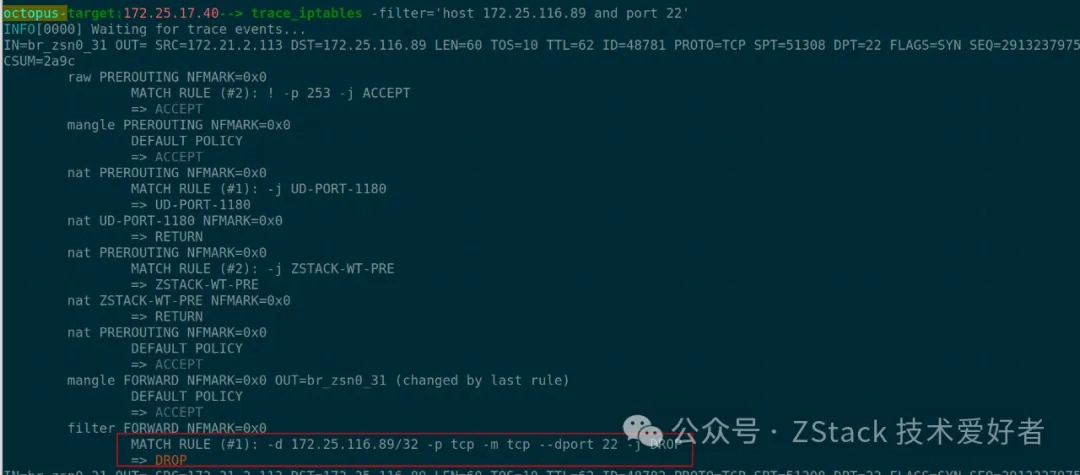
The following case clearly points out the iptables rule problem:
One of the core tasks of private cloud is to virtualize the user’s physical resources. For the network, network switches and virtual network cards are virtualized on physical nodes to exchange data between VMs. When the network is abnormal, it is often necessary to use packet capture tools on these virtual devices to capture network packets to diagnose network problems. Whether using open source community openvswitch, Linux bridge, or self-developed virtual switches, there will be more than a dozen or even more than 20 network devices (physical and virtual) between the source and the destination. Unless the operation and maintenance personnel are very familiar with the principles of network virtualization, it takes a lot of time to find these devices and their interconnection topology when the source and destination are given. In most cases, these devices are in different physical nodes, such as different computing nodes, network nodes, and may even be in the namespace of the OS. It is often very time-consuming to log in to these nodes and use packet capture tools to capture packets for diagnosis on each node and device, which is beyond the knowledge scope of most operation and maintenance personnel. Octopus provides a set of commands to automate this complex process. [Designed as a set of commands to improve the flexibility and scalability of the tool]
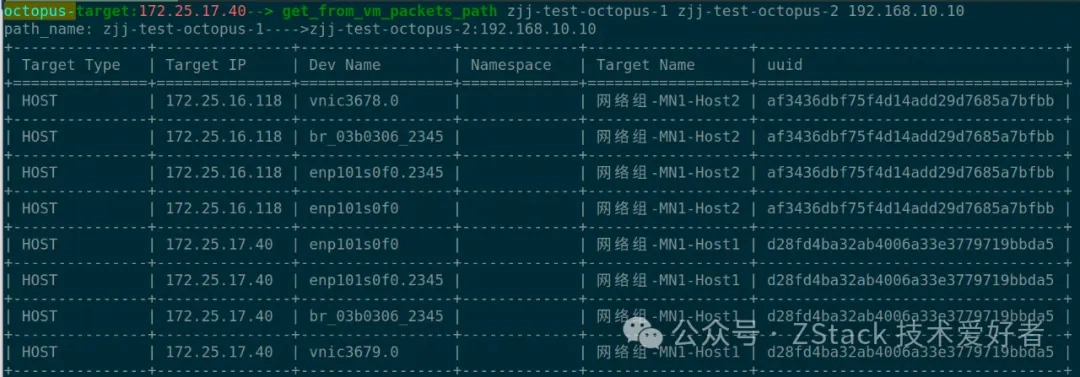
1.get_from_vm_packets_path gets all the paths between the source and the destination. This command can get the network path from a vm to any destination address. With the support of smart completion, users only need a few keystrokes to get the complete path, and support redirecting the result to a file.
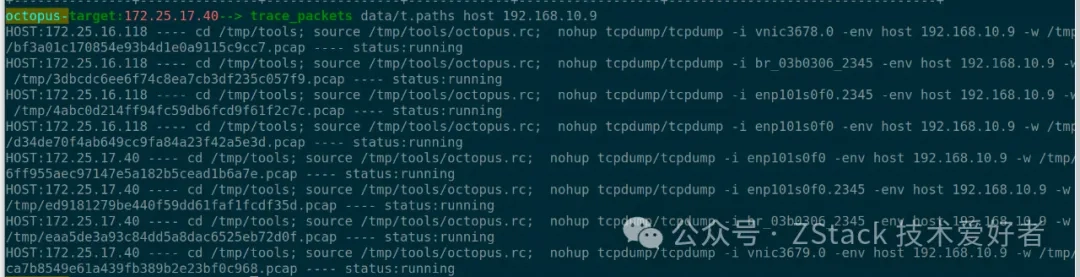
2.trace_packets This command starts the packet capture program on all devices of all nodes mentioned above. Assuming the path is in the data/t.paths file, the following parameter is the tcpdump filter
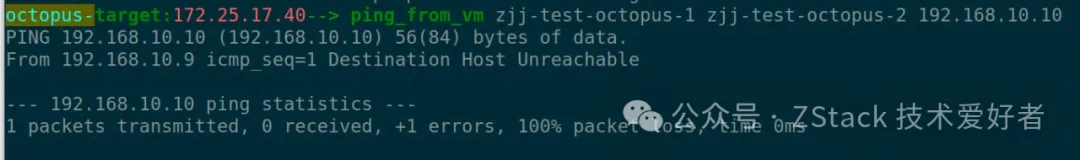
3.ping_from_vm starts the ping program from inside the vm. This command will ping the destination ip (belonging to a certain vm or any ip) from the source vm. There is no need to log in to the vm. We found that the network is not accessible.
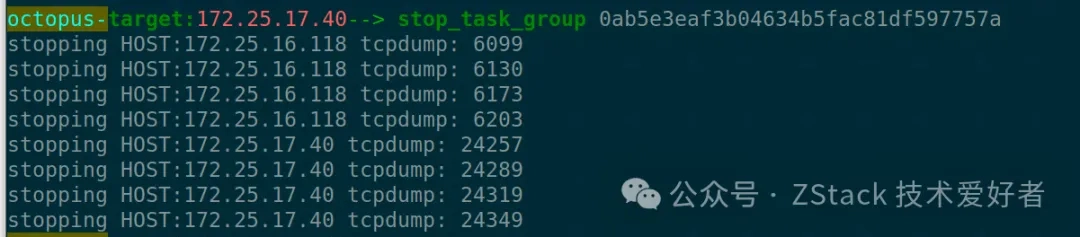
4.stop_task_group stops the packet capture process. After stopping, you can view the results and find out after which hop the packet is lost.
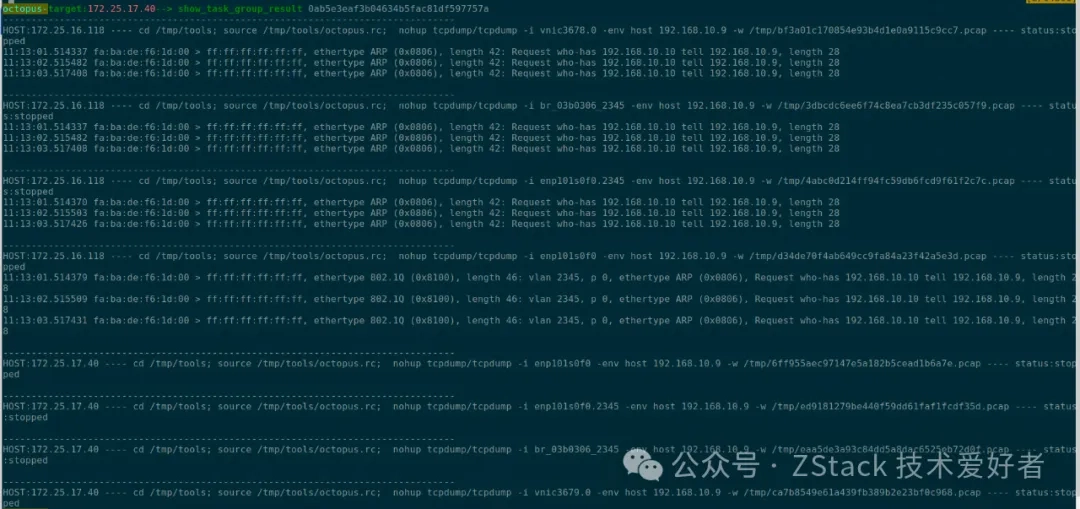
5.show_task_group_result, check the packet capture results and do analysis. It is easy to see that the ARP broadcast request of the source VM did not reach the physical network card of the physical machine where the destination VM is located.
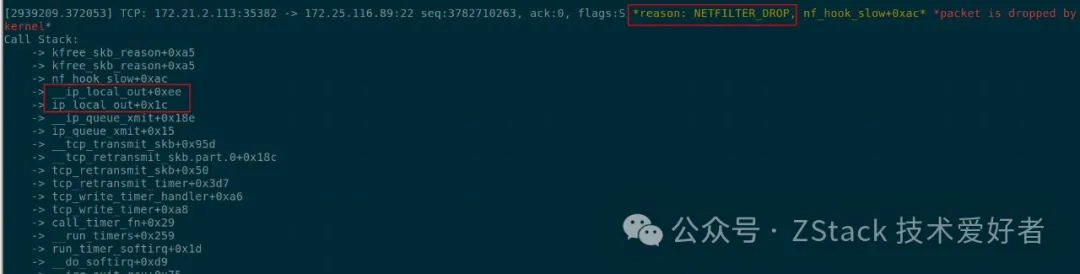
In most cases, the above troubleshooting can roughly determine the network cause, but sometimes you need to know the specific kernel code stack location that causes packet loss more accurately. Modern Linux kernels already support ebpf, which can be easily achieved through the ebpf tool
The above lists some network troubleshooting scenarios and methods supported by Octopus. The following briefly introduces some basic commands supported by Octopus.
This type of command outputs detailed information about various resources in the Cloud environment in a friendly way, including information that is not displayed on the GUI. It can be connected to the Linux shell through a pipe and processed using powerful command line tools, greatly improving the efficiency of information acquisition. For example, using the dump_vm_xml_info command, plus smart completion, you can get the XML configuration information of any VM within 2 seconds.
This command can be used to obtain the contents of any VM’s XML file within a few seconds, or redirected to the local computer to perform a difference comparison using a comparison tool.
With this command, you can open any log file of any node in a few seconds.
In some cases, the commands provided by Octopus cannot complete all the troubleshooting work for the time being, and you need to enter the node for in-depth troubleshooting. Through the ssh command, you can log in to any non-user role node within a few seconds, including management nodes, computing nodes, storage nodes, network nodes, etc.
Microsoft proposed the concept and architecture of pingmesh in data centers. In Octopus, you can immediately start ZStack Cloud‘s pingmesh through the network monitoring command. The network status between any physical nodes can be monitored and persisted, and graphical display is supported. When troubleshooting problems, you often encounter some problems that may be related to network jitter, such as performance jitter of distributed storage. To confirm whether it is caused by network jitter, you need to know the network reachability, latency and other data between nodes at a certain point in the past. With pingmesh, you can start it on demand and view it at any time.
1.start_network_monitor This command will start pingmesh on all platforms
2.del_network_monitor_from_node Stop network monitoring of a node
3.add_network_monitor_for_node Start network monitoring of a node
4.del_target_from_network_monitor_node Stop detection of a target IP from the monitoring node
5.add_target_to_network_monitor_node Start detection from a node to the target IP

The current functions are concentrated in three major areas: framework, basic commands and core network troubleshooting. Its functions will continue to be expanded in the future, making it easier to troubleshoot application call chains, application and cloud system integration, customer-specified functions, distributed storage, computing virtualization, etc.
For the sake of flexibility, some of the current core troubleshooting processes are implemented as a combination of several commands. Some commands require operation and maintenance personnel to have some basic knowledge of the corresponding modules and the resource model of ZStack Cloud. In the future, higher-level commands will be gradually provided. Most troubleshooting will only require one command, and most commands will require no or only very few parameters.
In the future, we will use machine learning and big data analysis technologies to enable Octopus to learn and analyze historical fault data, thereby continuously optimizing the troubleshooting process and improving the accuracy and efficiency of problem location.
Octopus is an intelligent automated troubleshooting tool designed specifically for private cloud environments. By integrating multiple diagnostic and analysis functions, it can quickly and accurately locate system problems and provide corresponding solutions. We hope that this tool can help more technology enthusiasts and operation and maintenance personnel, improve the efficiency of system maintenance and management, and make operation and maintenance easier and more efficient.
If you are interested in Octopus, please contact us for more information or to experience the version. Let us move towards a new era of intelligent operation and maintenance together!
Through this article, we have introduced the functions, application scenarios, technical architecture and future development direction of Octopus in detail, hoping to bring some valuable information to technology enthusiasts. We look forward to your feedback and suggestions to make Octopus more complete and powerful.
 2025-02-05
2024-09-21
2024-10-24
2024-10-17
2025-02-11
2024-09-23
2025-02-05
2024-09-21
2024-10-24
2024-10-17
2025-02-11
2024-09-23